TL;DR
Imagine that you are sending an HTTP request from one app; this one sends it to another app that sends it to another app. What if something happens along the way?
You need to mark all the requests to pinpoint where the problem occurred.
In this tutorial, you'll learn how to use OpenTelemetry to monitor your applications with insights into performance, tracing, and metrics.
You will learn:
- How to monitor our application using OpenTelemetry.
- How to view logs and ship traces.
- How to view Metrics and filter the traces.
- How to automate the monitoring of applications.
Odigos - Open-source Distributed Tracing
Monitor all your apps simultaneously without writing a single line of code!
Simplify OpenTelemetry complexity with the only platform that can generate distributed tracing across all your applications.
We are really just starting out.
Can you help us with a star? Plz? 😽
https://github.com/keyval-dev/odigos
Let's set it up🔥
Here, I'll walk you through installing the package dependencies required for this project.
Create your project folder for the web application as done below.
mkdir monitor-app
cd monitor-app
mkdir server
Setting up the Node.js server 🤖
Navigate into the server folder and create a package.json file.
cd server && npm init -y
Install Express.
npm install express
ExpressJS is a back-end web application framework for building RESTful APIs with Node.js.
Create an index.js file - the entry point to our web server.
// 👇server/index.js
touch index.js
Set up a Node.js server using Express. The code snippet below returns a JSON object with one key when we do a get request to /static-data or /fetch-data endpoint in our browser.
 // 👇server/index.js
const express = require("express");
const app = express();
const PORT = 8000;

app.use(express.urlencoded({ extended: true }));
app.use(express.json());

app.get("/static-data", (req, res) => {
  res.json({
    msg: "Hello world!",
  });
});

app.get("/fetch-data", (req, res) => {
  // Simulate a real-world database call
  setTimeout(() => {
    res.json({
      msg: "Hello world!",
    });
  }, 2000);
});

app.listen(PORT, () => {
  console.log(`The server is listening on port: ${PORT}`);
});
💡TIP OF THE DAY
Since the node version v18.11.0 we no longer need nodemon to watch for changes and restart the server, it is now built into Node with--watchflag.
Configure node --watch by adding the start & trace-start command to the list of scripts in the package.json file.
// 👇server/package.json
"scripts": {
  "test": "echo \"Error: no test specified\" && exit 1",
  "start": "node --watch index.js",
  "trace-start": "node -r ./tracing.js --watch index.js"
},
-
start: The code snippet starts the web server. -
trace-start: This code snippet starts the web server while preloading thetracing.jsfile. We will be using this command for demonstration.
Manually Setting up OpenTelemetry and SigNoz ⚒️
OpenTelemetry is used to instrument, generate, collect, and export telemetry data. SigNoz is an open-source APM. It helps developers monitor their applications & troubleshoot problems, an open-source alternative to other APMs available. It is a one-stop solution to get access to metrics, logs, and traces of an application.
We'll start by installing the required OpenTelemetry packages.
⚠️ If you are running this on Windows, run each of these commands individually.
npm install --save @opentelemetry/sdk-node \
@opentelemetry/auto-instrumentations-node \
@opentelemetry/exporter-trace-otlp-http
For SigNoz installation, follow the installation steps shown here.
Instantiate tracing by creating a tracing.js file and using the below code.
    // 👇server/tracing.js
"use strict";
const process = require("process");
const opentelemetry = require("@opentelemetry/sdk-node");
const {
  getNodeAutoInstrumentations,
} = require("@opentelemetry/auto-instrumentations-node");
const {
  OTLPTraceExporter,
} = require("@opentelemetry/exporter-trace-otlp-http");
const { Resource } = require("@opentelemetry/resources");
const {
  SemanticResourceAttributes,
} = require("@opentelemetry/semantic-conventions");

const exporterOptions = {
  url: "http://localhost:4318/v1/traces", // default URL for sending tracing data.
};

const traceExporter = new OTLPTraceExporter(exporterOptions);
const sdk = new opentelemetry.NodeSDK({
  traceExporter,
  instrumentations: [getNodeAutoInstrumentations()],
  resource: new Resource({
    [SemanticResourceAttributes.SERVICE_NAME]: "Monitor-Node-App",
  }),
});

// initialize the SDK and register with the OpenTelemetry API
sdk.start();

// shut down the SDK on process exit
process.on("SIGTERM", () => {
  sdk
      .shutdown()
      .then(() => console.log("Tracing terminated!"))
      .catch((error) => console.log("Error terminating tracing.", error))
      .finally(() => process.exit(0));
});
We are monitoring our Node application using the Node SDK @opentelemetry/sdk-node for tracing and metrics, @opentelemetry/auto-instrumentations-node for easy setup of instrumentations, and @opentelemetry/exporter-trace-otlp-http for exporting trace data to OTLP-compatible receivers via HTTP and JSON.
We are done with the basic instrumentation of our demo Node application with OpenTelemetry and SigNoz 🥂. Now, run the trace-start command.
npm run trace-start
Visit the SigNoz UI http://localhost:3301. We should be presented with something like this after we log in.
Don't worry about all this data; it is pre-populated by SigNoz. Note that we do not see our Monitor-Node-App in the list of services. This is because we have not made requests to our server.
For SigNoz to show the traces, we need to generate some load on our server. For this, we can refresh endpoints multiple times on our browser or run the following CLI command on our endpoints /static-data or /fetch-data to automatically do that for us.
For Linux Users
ℹ️ Make sure to have
curlinstalled.
for i in {1..20}; do curl http://localhost:8000/fetch-data; done
For Windows Users
1..20 | ForEach-Object { Invoke-RestMethod -Uri 'http://localhost:8000/fetch-data' }
Now, on visiting the SigNoz UI once again we should see our service in the list of services.
In this trace, we can exactly see how much time each part of the entire request took. In our case not many, since the request is fairly simple.
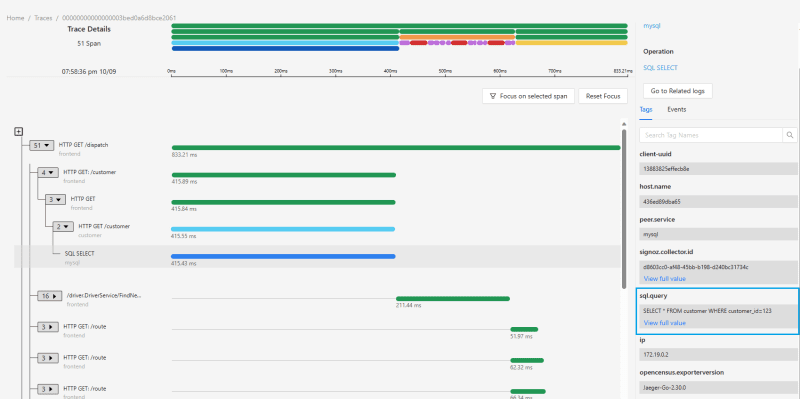
For proper visualization, we will take a look at the request from one of the demo applications already provided with SigNoz.
As we can clearly see, the first request which basically executes SQL Query goes through multiple steps, and, at last, it finally executes the SQL query. We can also see the time taken for each span in the request.
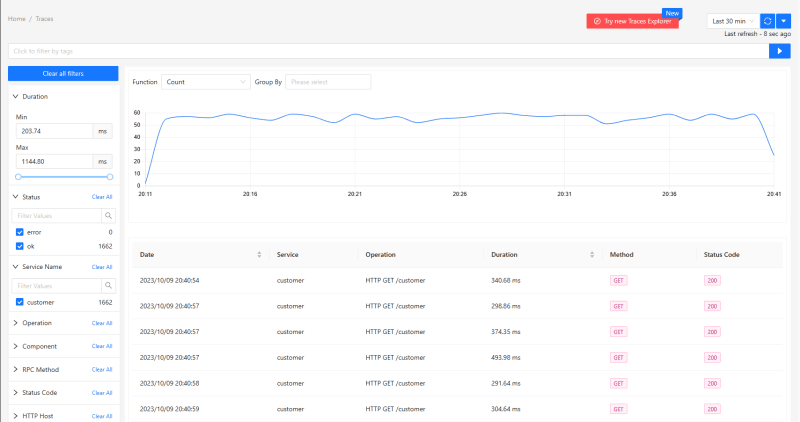
SigNoz's Traces dashboard offers ready-made visualizations for our tracing data. It includes strong filters to analyze the spans based on our selected criteria and chosen time frame.
Visualize Metrics from Hostmetrics 👀
The most common way to accept metrics in SigNoz is through the Prometheus receiver.
For simplicity, I will demonstrate how to Visualize default metrics provided by Hostmetrics that is by default enabled on SigNoz installation.
All the list of available metrics can be found here.
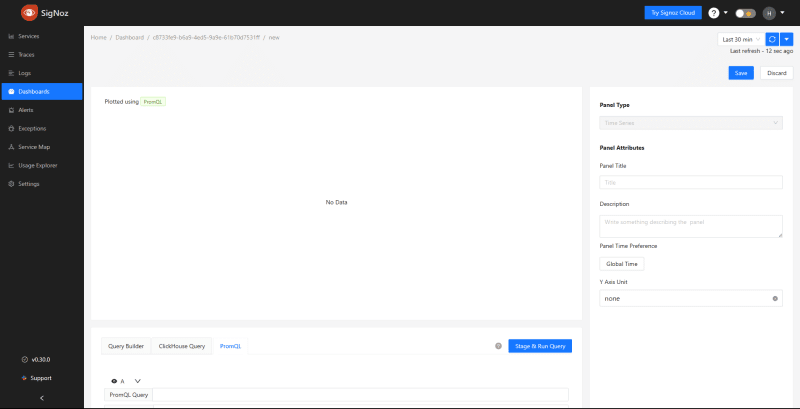
Under the Dashboards section in the SigNoz UI, create a new Time Series panel.
In the PromQL query input, please enter the following: For example, let's use the metric system_cpu_load_average_5m, as the name suggests it gives the 5-minute load average of the CPU. Feel free to adjust the metric to your preference.
Automatically connect with Odigos 🤝
Odigos is an open-source observability control plane that enables organizations to create and maintain their observability pipeline.
Remember all the hassle we went through when manually setting up? With Odigos, there's no need for that. It automatically instruments our application, eliminating the need to set up OpenTelemetry or anything on our own. Odigos handles it all for us. 🤯
Instructions on how to install Odigos can be found here.
We need to install SigNoz on Kubernetes so that OpenTelemetry can send the collected data to it.
SigNoz can be installed on Kubernetes easily using Helm:
helm repo add signoz https://charts.signoz.io
kubectl create ns platform
helm --namespace platform install my-release signoz/signoz
To port forward SigNoz UI on our local machine, run the following.
export POD_NAME=$(kubectl get pods --namespace platform -l "app.kubernetes.io/name=signoz,app.kuber
    netes.io/instance=my-release,app.kubernetes.io/component=frontend" -o jsonpath="{.items[0].metadata.name}")

kubectl --namespace platform port-forward $POD_NAME 3301:3301
Now, you can access the SigNoz UI on http://localhost:3301
For the demonstration, we will use another e-commerce application from Google to get a bigger picture of distributed tracing. The repo does not contain any instrumentation or monitoring setup.
Create a clone of this repository microservices-demo
git clone https://github.com/keyval-dev/microservices-demo.git
Create a new local Kubernetes cluster, by running the following command. We will need it when setting up Odigos.
ℹ️ For Windows Users, make sure to have Docker Desktop running.
minikube start
Instructions on how to install minikube can be found here.
Deploy the cloned application with the following command
kubectl apply -f https://raw.githubusercontent.com/keyval-dev/microservices-demo/master/release/kubernetes-manifests.yaml
Start the Odigos UI with the following command.
./odigos ui
Visit the Odigos UI on localhost:3000. Select all the microservices in the namespace as shown below.
After selecting all the applications we will be asked for:
- Destination Name: A name for our destination.
- Host Endpoint: Use the host endpoint for SigNoz.
After doing this, we should now be prompted with the following UI.
Congratulations🎉! The Odigos setup has been successful. Now, it should automatically send traces, metrics, and logs to our observability backend.
Now, to see that in practice, we need to first set up the external IP for our frontend-external LoadBalancer service.
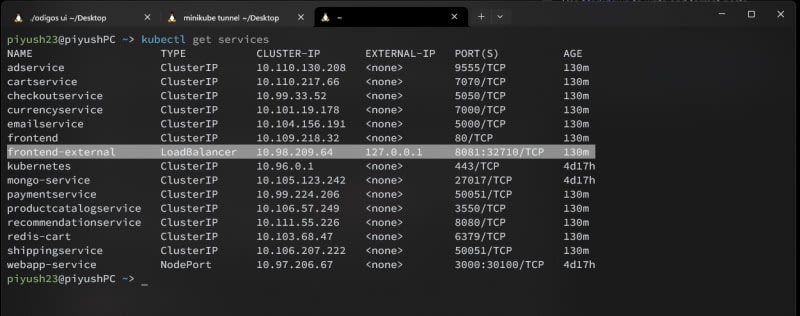
Running the kubectl get services command should show the following. Notice the <pending> IP for the external-frontend service.
By default, it is not possible to access LoadBalancer service on the browser. For this, we need to set up minikube tunnel. For more info on this command visit here.
minikube tunnel
kubectl get services
Now, we can see the IP and port assigned to the external-frontend service.
Visit http://127.0.0.1:8081 on the browser to access the application.
Run the SigNoz service and execute the following command.
kubectl port-forward -n tracing svc/<service_name> <port_to_use>:<port>
Now, we should be able to view all the traces of our application as we did previously.
Wrap Up! 📝
So far, we've learned how to closely monitor our app's performance with traces and Hostmetrics, first manually using OpenTelemetry and SigNoz, and then automating the process with Odigos.
Note: We are not limited to using SigNoz; we can use any observability database out there. Just for the sake of this article, I have chosen to use SigNoz.
It is always a good idea to have a monitoring system for any production-level application. This will help us debug errors if any arise in the future. Most importantly, it will help us identify any performance bottlenecks in our application, resulting in enhanced efficiency and user experience.
The source code for this tutorial is available here:
https://github.com/keyval-dev/blog/tree/main/instrumenting-node-app
Thank you for reading! 🎉


Top comments (9)
Odigos surely looks like a great tool.
Thank you for the great feedback 😄
Odigos seems to be a great tool!
Maximizing monitoring automation. 😲😲
That's exactly our goal :)
We want to make monitoring applications as easy as possible.
This looks like a great tool, thanks for writing a great article!
Thank you!
Looks like Odigos can save you a lot of time!
Nice way to automate instrumenting!
Glad that you liked it! Check out our documentation for more info: docs.odigos.io/